ChartPlot
Reference
Constructor
new ( [width [, height]] )
Create a new empty image, its default size is 400 by 300 pixel.
Methods
setData ( xdata, ydata [, style] )
Acquires a dataset. xdata and ydata must be table of the same size.
The optional string style could contains a concatenation of graphing style option, as
black,red,green,bluesolidline,dashedline,nolinepoints,nopoints
The default value of style is line points and the default color is black.
setTag ( tags )
Adds tags to the latest/current dataset.
tags must be a table containing string or false.
By default, tags are written with horizontal mode.
The word up in style option allows the vertical mode.
setGraphOptions ( tbl )
Sets some options from the table tbl, the following keys are handled :
title, a stringhorGraphOffset, the default value is 50 pixelvertGraphOffset, the default value is 50 pixelhorAxisLabel, a stringvertAxisLabel, a stringxTickLabels, a table where keys are number and values are stringyTickLabels, a table where keys are number and values are string
data2px ( x, y )
Returns the pixel coordinates.
getBounds ()
Returns the data values of the lowerleft corner and upper right corner,
ie. xmin, ymin, xmax, ymax.
draw ( [fmt] )
Draws the image and returns it as a string (this is the last method called).
The string fmt specify the output format, png or jpeg are valid, the default value is png.
getGDobject ()
Returns the internal GD image.
Examples
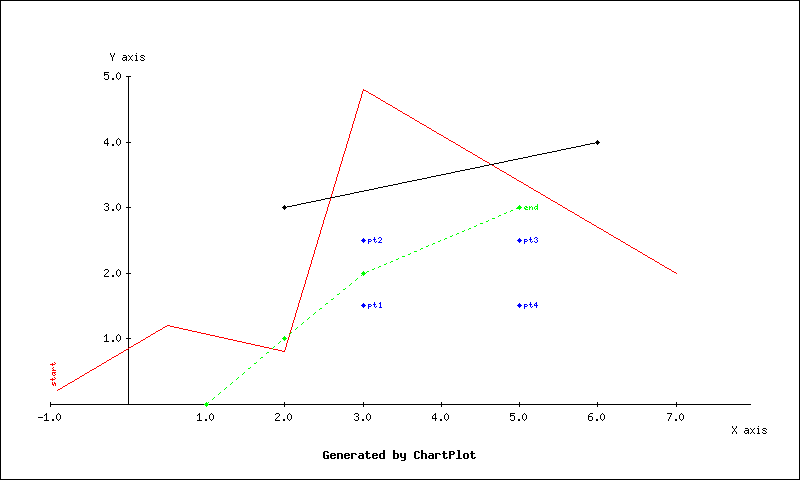
local cp = require 'ChartPlot'
local img = cp.new(800, 480)

img:setData({ -0.9, 0.5, 2, 3, 7 }, { 0.2, 1.2, 0.8, 4.8, 2.0 }, 'red nopoints up')
img:setTag({ 'start' })
img:setData({ 1, 2, 3, 5 }, { 0, 1, 2, 3 }, 'green dashed')
img:setTag({ false, false, false, 'end' })
img:setData({ 3, 3, 5, 5 }, { 1.5, 2.5, 2.5, 1.5 }, 'blue noline')
img:setTag({ 'pt1', 'pt2', 'pt3', 'pt4' })
img:setData({2, 6}, { 3, 4 })

img:setGraphOptions{
    title               = 'Generated by ChartPlot',
    horAxisLabel        = 'X axis',
    vertAxisLabel       = 'Y axis',
}

local f = assert(io.open('example.png', 'wb'))
f:write(img:draw())
f:close()
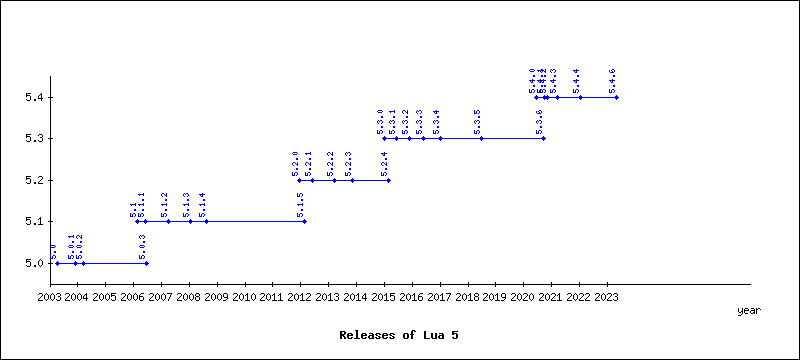
local cp = require 'ChartPlot'

local function date (t)
    local n = os.time(t) - os.time{year = t.year, month = 1, day = 1}
    local d = os.time{year = t.year+1, month = 1, day = 1} - os.time{year = t.year, month = 1, day = 1}
    return t.year + n / d
end

local function sorted_pairs (t)
    local keys = {}
    for k in pairs(t) do
        keys[#keys+1] = k
    end
    table.sort(keys)
    local i = 0
    return function ()
        i = i + 1
        local k = keys[i]
        if k then
            return k, t[k]
        end
    end
end

local data = {
    ['5.0'] = {
        ['0']       = date{year = 2003, month =  4, day = 11},
        ['1']       = date{year = 2003, month = 11, day = 25},
        ['2']       = date{year = 2004, month =  3, day = 17},
        ['3']       = date{year = 2006, month =  6, day = 19},
    },
    ['5.1'] = {
        ['0']       = date{year = 2006, month =  2, day = 20},
        ['1']       = date{year = 2006, month =  6, day =  7},
        ['2']       = date{year = 2007, month =  3, day = 29},
        ['3']       = date{year = 2008, month =  1, day = 21},
        ['4']       = date{year = 2008, month =  8, day = 18},
        ['5']       = date{year = 2012, month =  2, day = 13},
    },
    ['5.2'] = {
        ['0']       = date{year = 2011, month = 12, day = 16},
        ['1']       = date{year = 2012, month =  6, day =  8},
        ['2']       = date{year = 2013, month =  3, day = 21},
        ['3']       = date{year = 2013, month = 11, day = 11},
        ['4']       = date{year = 2015, month =  2, day = 25},
    },
    ['5.3'] = {
        ['0']       = date{year = 2015, month =  1, day =  6},
        ['1']       = date{year = 2015, month =  6, day = 10},
        ['2']       = date{year = 2015, month = 11, day = 25},
        ['3']       = date{year = 2016, month =  5, day = 30},
        ['4']       = date{year = 2017, month =  1, day = 12},
        ['5']       = date{year = 2018, month =  6, day = 26},
        ['6']       = date{year = 2020, month =  9, day = 14},
    },
    ['5.4'] = {
        ['0']       = date{year = 2020, month =  6, day = 18},
        ['1']       = date{year = 2020, month =  9, day = 30},
        ['2']       = date{year = 2020, month = 11, day = 13},
        ['3']       = date{year = 2021, month =  3, day = 15},
        ['4']       = date{year = 2022, month =  1, day = 13},
        -- ['5']       = date{year = 2023, month =  4, day = 18}, retracted
        ['6']       = date{year = 2023, month =  5, day =  2},
    }
}

local img = cp.new(800, 360)

local yTickLabels = {}
local y = 0.5
for major, set in sorted_pairs(data) do
    yTickLabels[y]= major
    local xdata = {}
    local ydata = {}
    local tags = {}
    for minor, date in sorted_pairs(set) do
        xdata[#xdata+1] = date - 2003
        ydata[#ydata+1] = y
        local lbl = major
        if minor ~= '0' or major >= '5.2' then
            lbl = lbl .. '.' .. minor
        end
        tags[#tags+1] = lbl
    end
    img:setData(xdata, ydata, 'blue up')
    img:setTag(tags)
    y = y + 1
end
local xTickLabels = {}
for x = 2003, 2023 do
    xTickLabels[x - 2003] = tostring(x)
end

img:setGraphOptions{
    title               = 'Releases of Lua 5',
    horAxisLabel        = 'year',
    xTickLabels         = xTickLabels,
    yTickLabels         = yTickLabels,
}

local f = assert(io.open('lua.png', 'wb'))
f:write(img:draw())
f:close()